Time-Driven Project Intelligence through Custom Web Visualization
Our 4D visualization enhances the web experience by creating time-based project data that is clear and interactive. It accelerates progress, mitigates risks, and tracks execution efficiency.
Book an AppointmentLarge-scale infrastructure, construction, and capital engineering projects rely on tight schedules and digital tools. However, time-based insights remain fragmented across systems. 4D visualization combined with schedule visualization creates unified connections among project schedules, assets and execution into a time-based view of project.
Our solution helps project teams and leadership gain visibility into activities unfolding on sites. The key services delivered through our 4D visualization dashboard are outlined in each section.

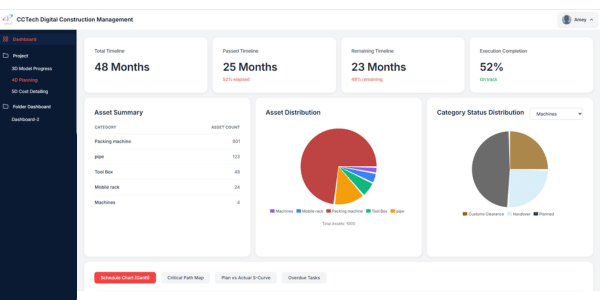
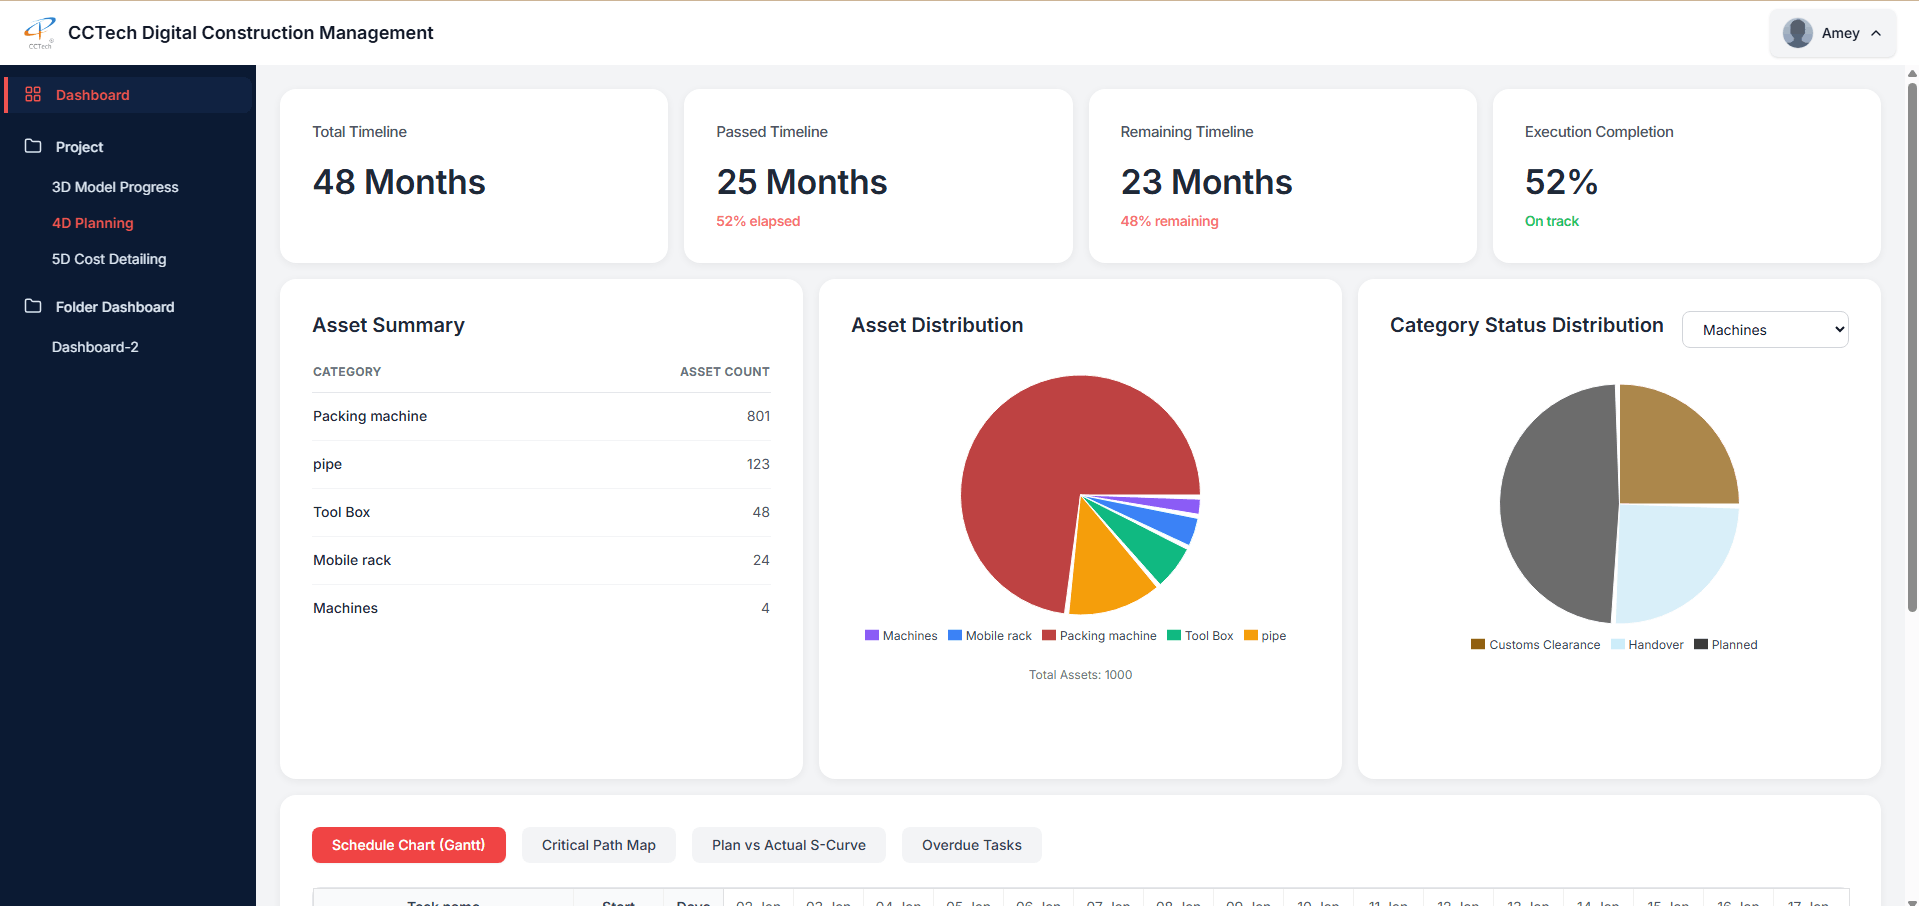
The 4D visualization dashboard provides a consolidated view of progress and processes to the stakeholders instantly. Users no longer need to hustle among multiple charts, spreadsheets, and can instantly depend on schedule visualization to know how time, scope, and execution are aligned across the project.
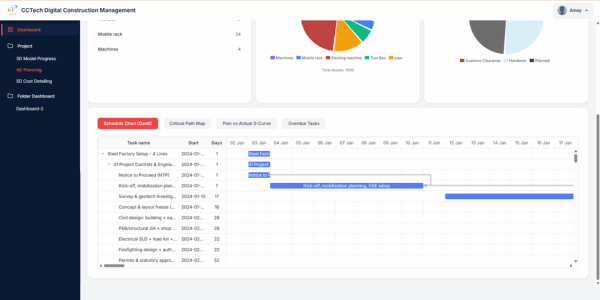
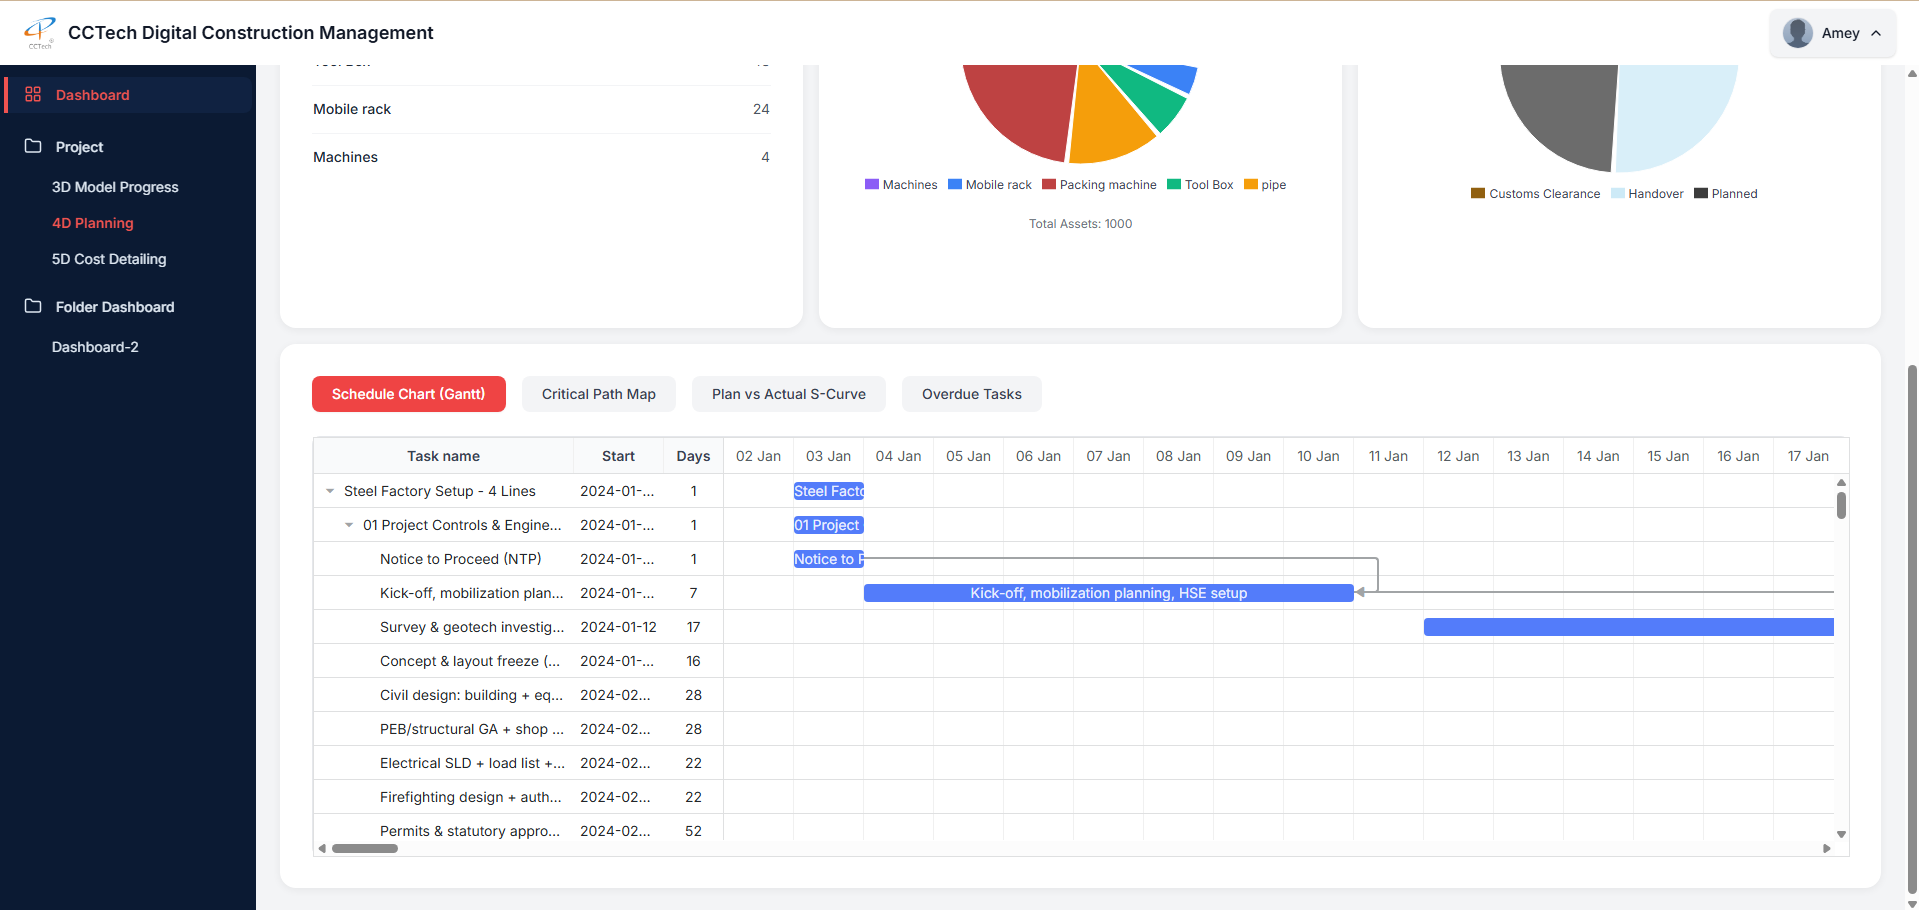
The key feature of 4D visualization is an interactive, web-based schedule view. It allows teams for easy navigation between complex milestones and task sequences. Activities impacting project completion are automatically flagged to help teams prioritize their efforts.
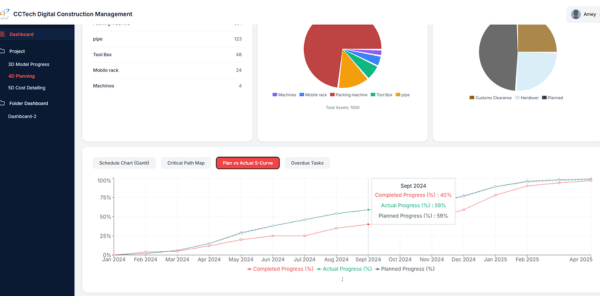
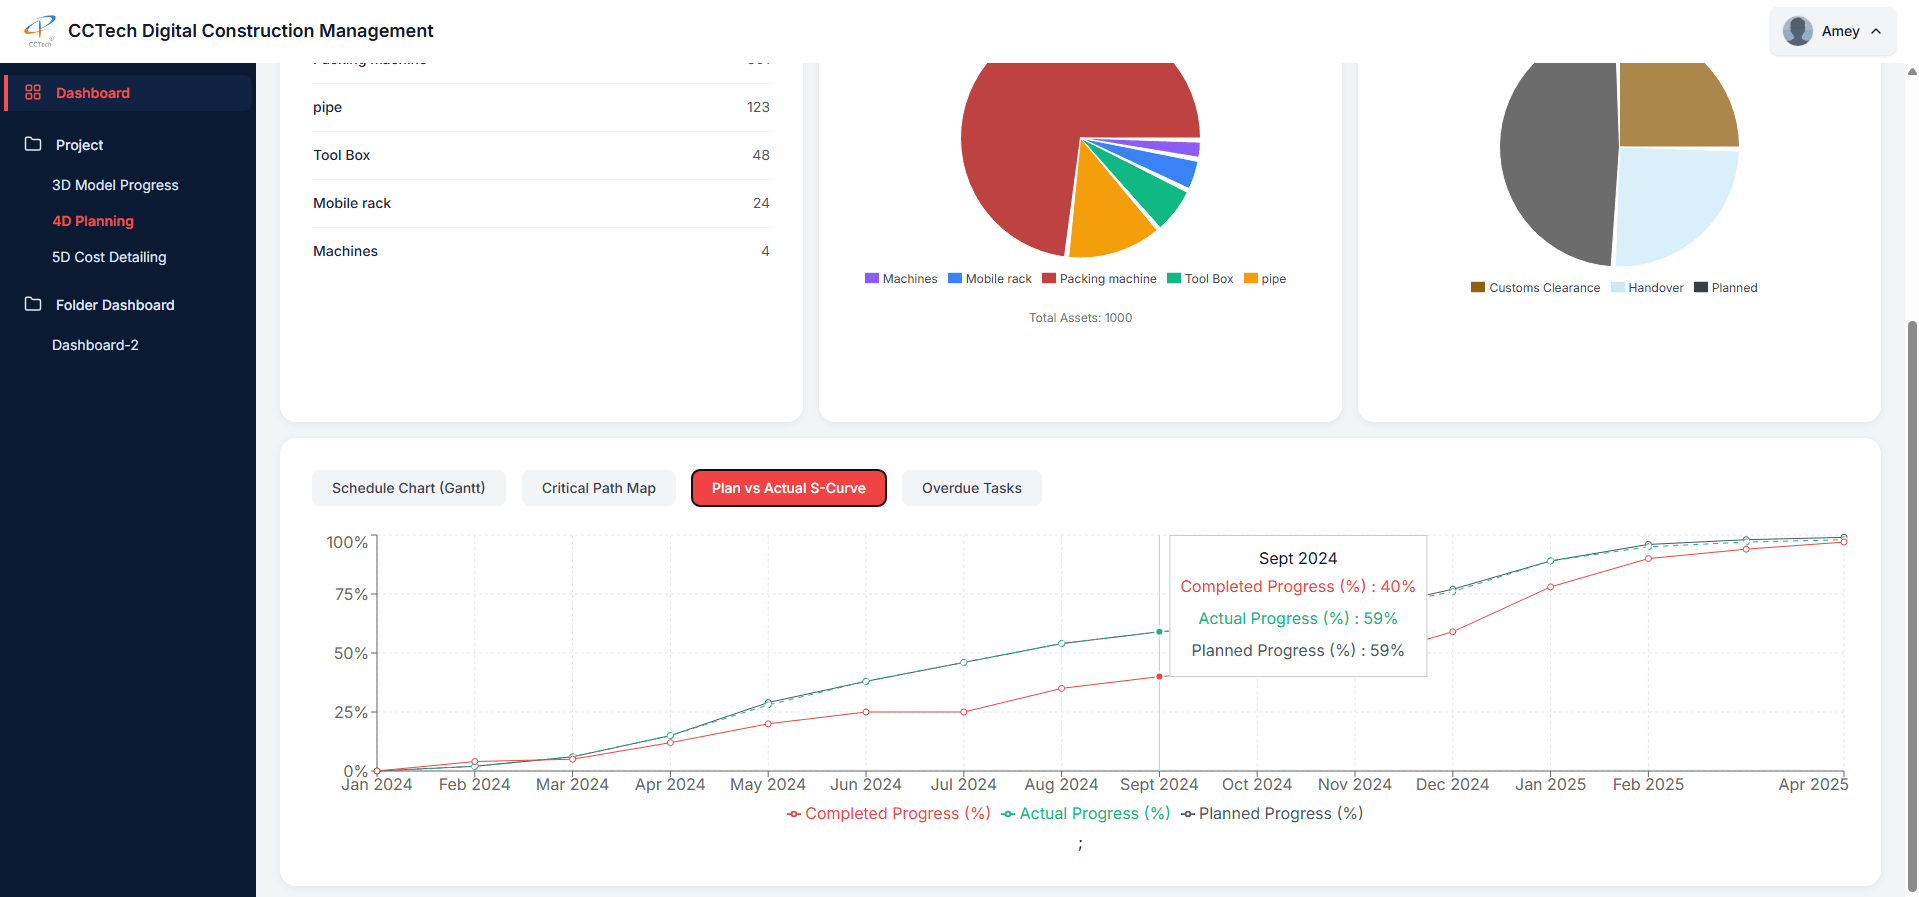
Progress tracking not only focuses on percentages. It implies trends and risks over time. The 4D schedule visualization dashboard compares planned progress with actual execution, highlighting the deviations. Combination of progress curves with overdue task intelligence, teams gain early warnings and the ability to act before delays escalate.
The 4D visualization dashboard provides a consolidated view of progress and processes to the stakeholders instantly. Users no longer need to hustle among multiple charts, spreadsheets, and can instantly depend on schedule visualization to know how time, scope, and execution are aligned across the project.
Our offerings
The key feature of 4D visualization is an interactive, web-based schedule view. It allows teams for easy navigation between complex milestones and task sequences. Activities impacting project completion are automatically flagged to help teams prioritize their efforts.
Our offerings
Progress tracking not only focuses on percentages. It implies trends and risks over time. The 4D schedule visualization dashboard compares planned progress with actual execution, highlighting the deviations. Combination of progress curves with overdue task intelligence, teams gain early warnings and the ability to act before delays escalate.
Our offerings
© 2006 – 2026 Copyright, Centre for Computational Technologies Pvt. Ltd. All rights reserved.